Introduction
In today's data-driven digital landscape, website dashboards have become critical tools for transforming raw data into clear, actionable insights. By combining Google Analytics' robust tracking features with the dynamic visualization power of Looker Studio (formerly Google Data Studio), you can design dashboards that not only inform but inspire strategic action.
Why Dashboard Design Matters
A dashboard is more than a collection of charts—it’s a storytelling medium. A thoughtfully designed dashboard helps teams understand user behavior, identify trends, and align their decisions with measurable data. On the other hand, cluttered or overly technical dashboards hinder usability and adoption.
- Clarity: Use clear labels and visuals to make the data easy to interpret at a glance.
- Relevance: Focus only on metrics that support key objectives.
- Interactivity: Enable filters and time selectors for dynamic exploration.
- Visual Appeal: Apply clean layouts, consistent colors, and intuitive charts.
Step 1: Setting Up Google Analytics
Start by configuring GA4, which enables event-based tracking and offers predictive metrics suited for modern dashboards. Use Google Tag Manager to streamline tag management and define key events like form submissions, product views, or downloads. Regular audits ensure your data remains accurate and trustworthy.
Step 2: Connecting Looker Studio
Looker Studio allows you to visualize Google Analytics data interactively. After creating a new report and linking your GA property, choose relevant metrics:
- Traffic: Sessions, Users, Pageviews
- Engagement: Bounce Rate, Session Duration
- Conversions: Goal Completions, Revenue
- Audience Insights: Device type, geography
Step 3: Designing the Dashboard
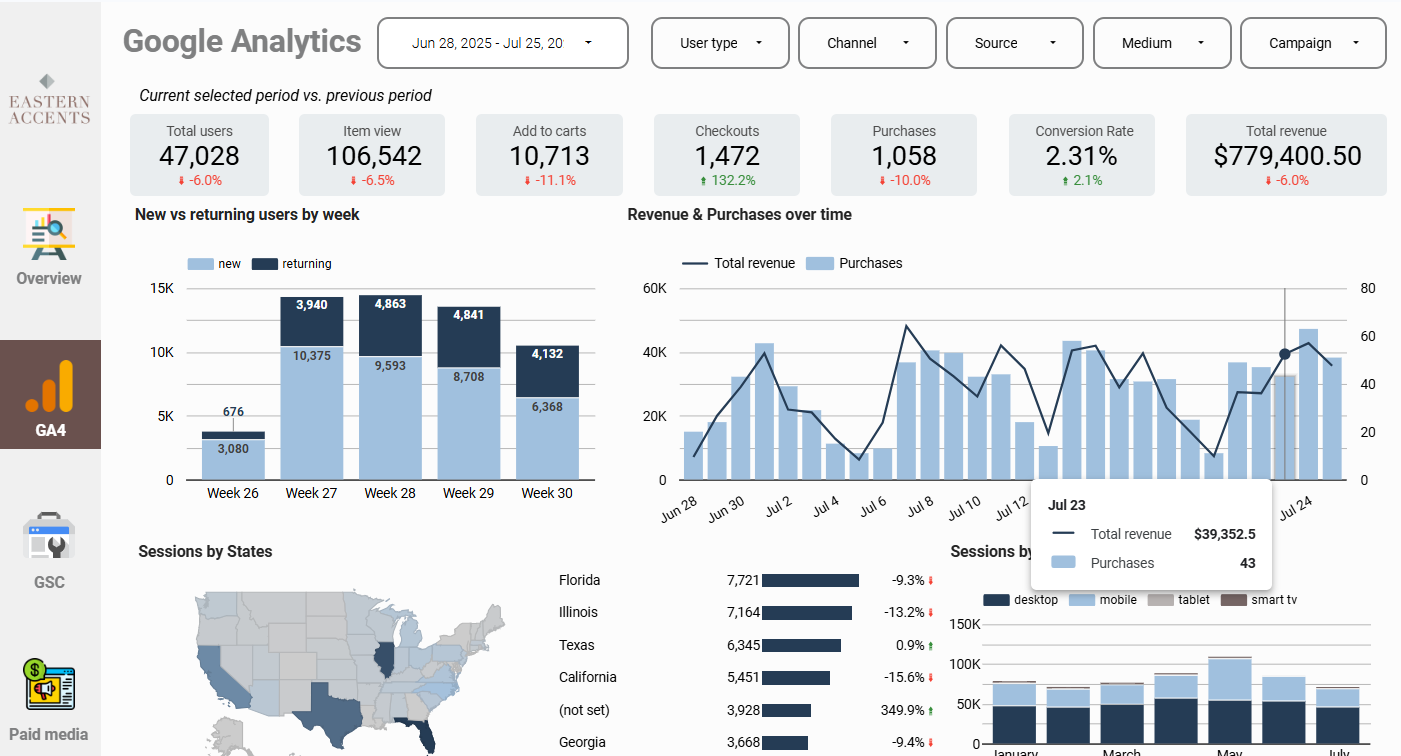
Use a structured layout with dedicated sections for Overview, Traffic, Behavior, and Goals. Incorporate time series charts for trends, bar charts for comparisons, and scorecards for KPIs. Customize the report’s branding, add tooltips for explanation, and insert date filters to enhance usability.
Best Practices
- Know your audience: Tailor views for marketers, executives, or product teams.
- Keep it focused: Avoid overloading the dashboard with too many charts.
- Update regularly: Refresh visuals and data sources quarterly to stay aligned with business needs.
- Ensure accessibility: Design responsive layouts for mobile users.
Conclusion
A well-structured dashboard powered by Google Analytics and Looker Studio transforms scattered data into strategic insight. By applying best practices in design, interactivity, and data storytelling, your dashboard becomes a vital tool for driving business growth.
Start building your dashboard today — and turn your data into a competitive edge.
FAQs
Q: Can I use Looker Studio with other data sources?
A: Yes, Looker Studio supports Google Ads, Search Console, BigQuery, and over 800 partner connectors.
Q: How do I keep dashboards mobile-friendly?
A: Use fewer widgets per row, large text, and responsive scorecards.

