Introduction
In today’s product-led world, successful digital businesses are no longer guessing what their users want — they’re tracking every meaningful interaction and turning data into action. With tools like Mixpanel and Firebase, businesses can gain real-time insights into user behavior, feature adoption, retention patterns, and engagement health. In this guide, we explore how to build a robust product analytics stack and strategy that fuels growth in 2025.
What Is Product Analytics — And Why It Matters
Product analytics is the process of collecting, interpreting, and acting on data about how users interact with your product. It focuses on the **"what," "how," and "why"** of user actions inside your app or platform — going far beyond basic marketing metrics.
Done right, product analytics helps you:
- Understand user journeys and feature usage
- Identify friction points or drop-off stages
- Track product-market fit via retention and engagement
- Prioritize your roadmap based on real behavior
- Drive personalization, messaging, and lifecycle campaigns
Core Tools: Mixpanel and Firebase
At Vlad's Digital, we build product analytics stacks using a combination of Mixpanel and Firebase — each covering different aspects of tracking, infrastructure, and visualization:
| Tool | Purpose | Example Use |
|---|---|---|
| Firebase (GA4) | Backend analytics, crash reporting, real-time events | Logins, device info, crashes, screen views |
| Mixpanel | Behavioral analytics, segmentation, retention, funnels | Feature usage, onboarding flow, cohort analysis |
| BigQuery | Advanced queries, joining raw data from Firebase + CRM | Power users by segment, LTV by source, cross-app usage |
Client Deliverables — What You Actually Get
When we implement product analytics, clients receive a complete, actionable analytics system tailored to their business goals. Here's what our standard delivery includes:
- Event tracking plan: A full blueprint of key user interactions, mapped to business objectives
- Custom Mixpanel dashboard: Funnels, cohorts, retention charts, engagement breakdowns
- Firebase integration: Real-time logging, crash monitoring, and device/session metrics
- Data schema & taxonomy: Clean event/property structure for long-term consistency
- BigQuery data pipeline (optional): For advanced joins and historical reporting
- Automated reports: Monthly executive summaries delivered via PDF or Slack/email
Strategies We Use for Deep Product Understanding
To go beyond surface-level reporting, we apply a multi-layered strategy:
- Funnel analysis: Identify drop-off in key flows (e.g. onboarding, checkout, upgrade)
- Cohort retention: Measure user stickiness based on signup week, source, or behavior
- User segmentation: Slice metrics by user type, country, plan, or app version
- Lifecycle mapping: Track how users move from activation to habit to churn
- A/B testing: Integrate with remote config (Firebase) or Mixpanel experiments
Visualizing Insights — Dashboards & Reports
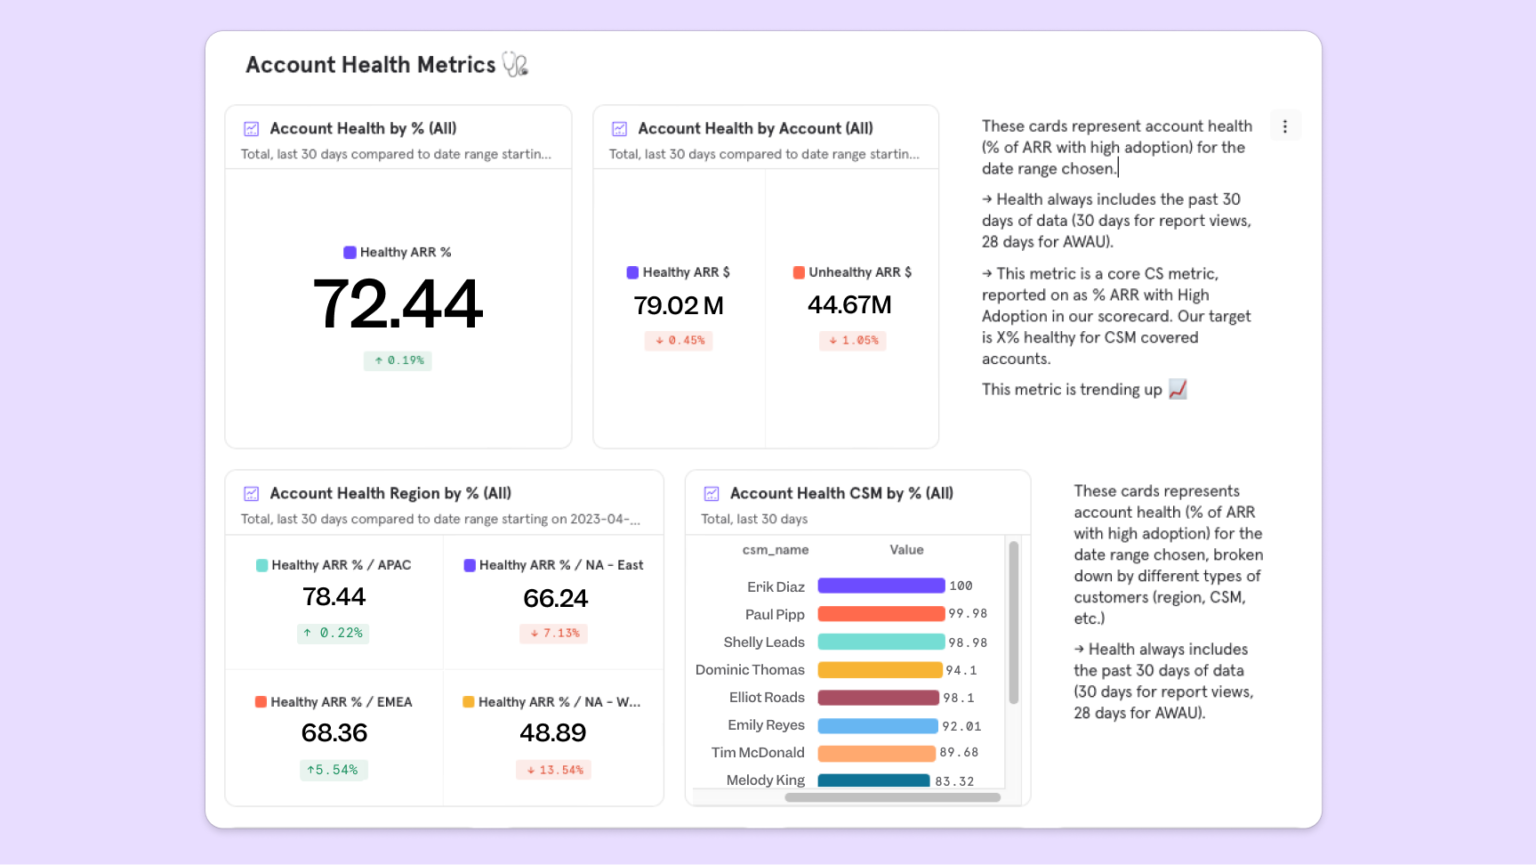
We don’t just collect data — we transform it into interactive dashboards that help your product and growth teams make fast decisions.
- Dashboards: Interactive Mixpanel dashboards organized by feature, audience, and flow
- Heatmaps (via FullStory or Hotjar): For click behavior and friction identification
- Weekly & monthly reports: Visualized KPIs with clear takeaways
- Alerting: Set thresholds for churn spikes, drop-off, or error increases
Here’s an example of how a dashboard might be structured:
- 📊 Engagement Overview: DAU, MAU, sessions, screen depth
- 🧭 User Flows: Entry points, navigation paths, feature interactions
- ⏳ Retention: 1-day, 7-day, 30-day active user cohorts
- 💸 Conversion: From freemium to paid or from browse to checkout
- 🚨 Drop-off: Pinpoint pages or events with highest abandonment
Case Study: Mobile App Retention Optimization
A SaaS client with a mobile productivity app struggled with 3-day retention. We implemented Firebase SDK for real-time logging and used Mixpanel to build event-based funnels. By identifying a missing activation step (tutorial skip), we redesigned the onboarding sequence and tested variants via A/B experiments. Result: 3-day retention jumped from 28% to 41% in 3 weeks.
Frequently Asked Questions
Q: Can I integrate both Firebase and Mixpanel at the same time?
A: Yes, we use Firebase for raw backend logging and Mixpanel for behavior analytics — together they provide a 360° view of the product.
Q: What platforms do you support?
A: Web (JavaScript), iOS, Android, React Native, and Flutter apps — with custom tagging plans per platform.
Q: What if I already have Google Analytics?
A: GA4 is great for acquisition and marketing; we recommend layering product analytics tools like Mixpanel on top for in-app behavior analysis.
Conclusion — Ready to Know Your Users Better?
Product analytics isn't a luxury — it's the backbone of modern digital product growth. By implementing a robust strategy using Mixpanel and Firebase, you can uncover insights that drive better UX, higher retention, and smarter product development.
Want to unlock the full potential of your app or platform? Schedule a free analytics discovery session today.

